Overview of an Application
Estimated reading time: 1 minute
OT Link Platform can run applications found under the Applications Overview section of the navigation panel. The Applications Overview section shows all available applications. It provides status, statistics, and shortcut commands for each installed application.
For more information on the Marketplace and adding more applications to OT Link Platform. See the Explore the OT Link Platform Marketplace section.
A flashcard represents each application currently installed on OT Link Platform. Each flashcard has a colored bar that represents the status of the application. Green represents a Running application and orange represents a Stopped application.
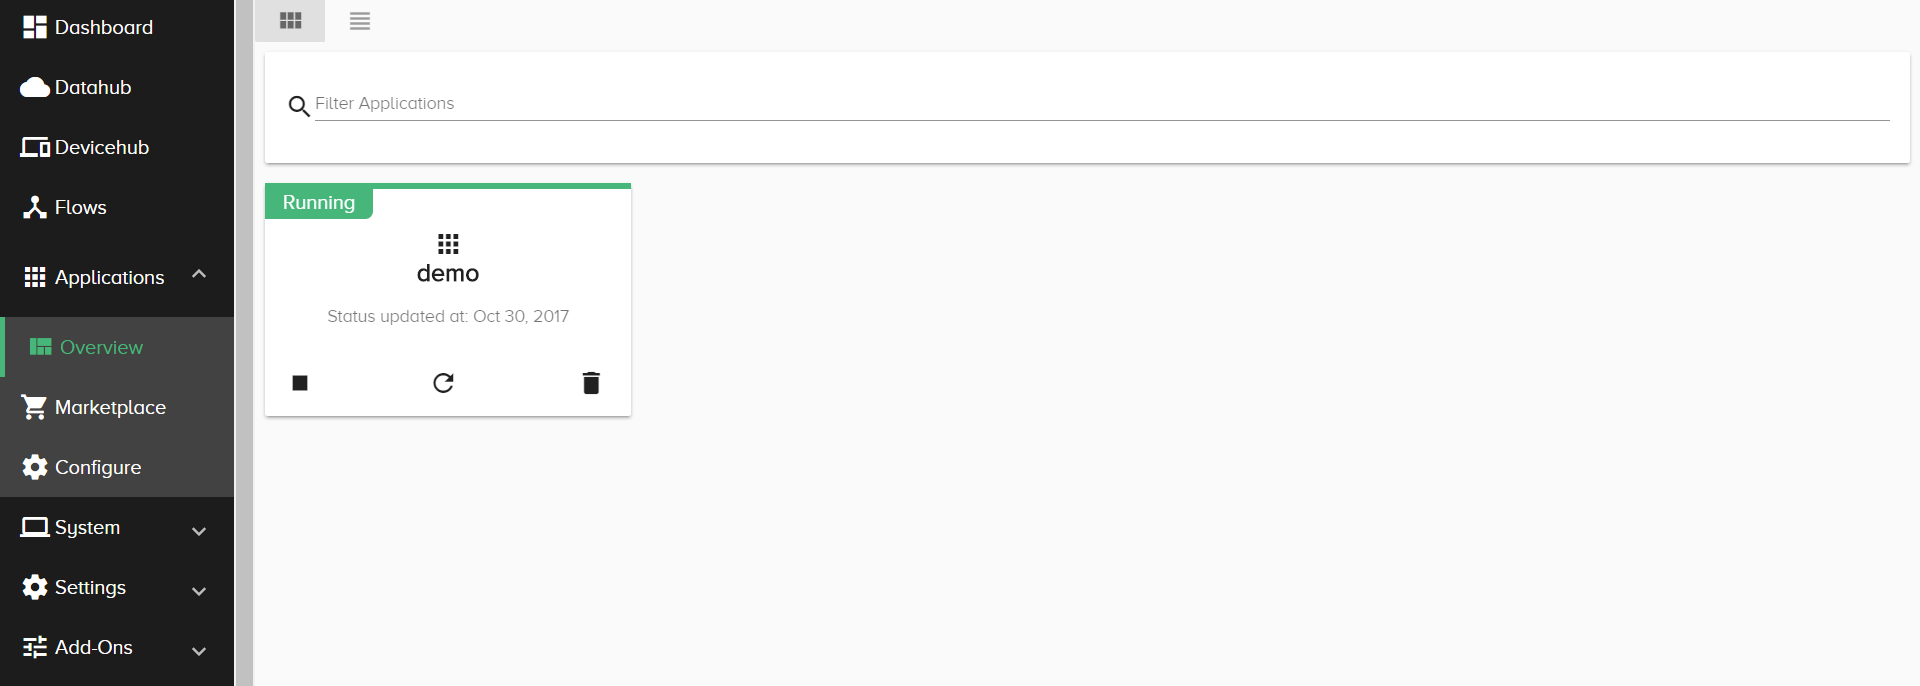
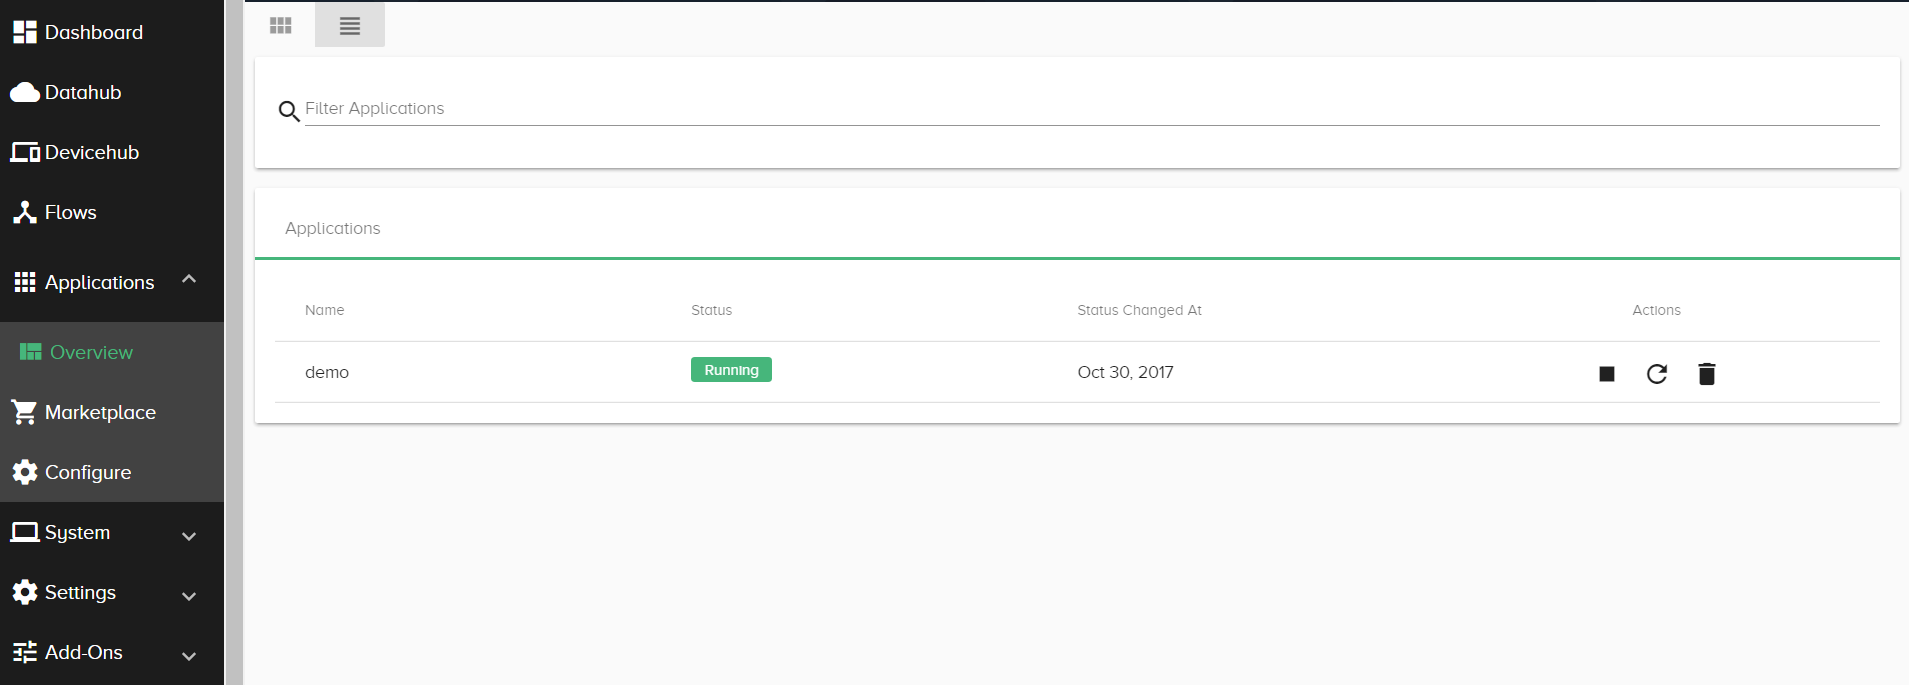
You can filter by name to show fewer application flashcards on the overview screen. You can also click list view above the filter bar and on the right to view all applications as a list.
Clicking an Application provides the IP address, port number, memory usage, and the up state of the application. The up state indicates how long an application has been running.
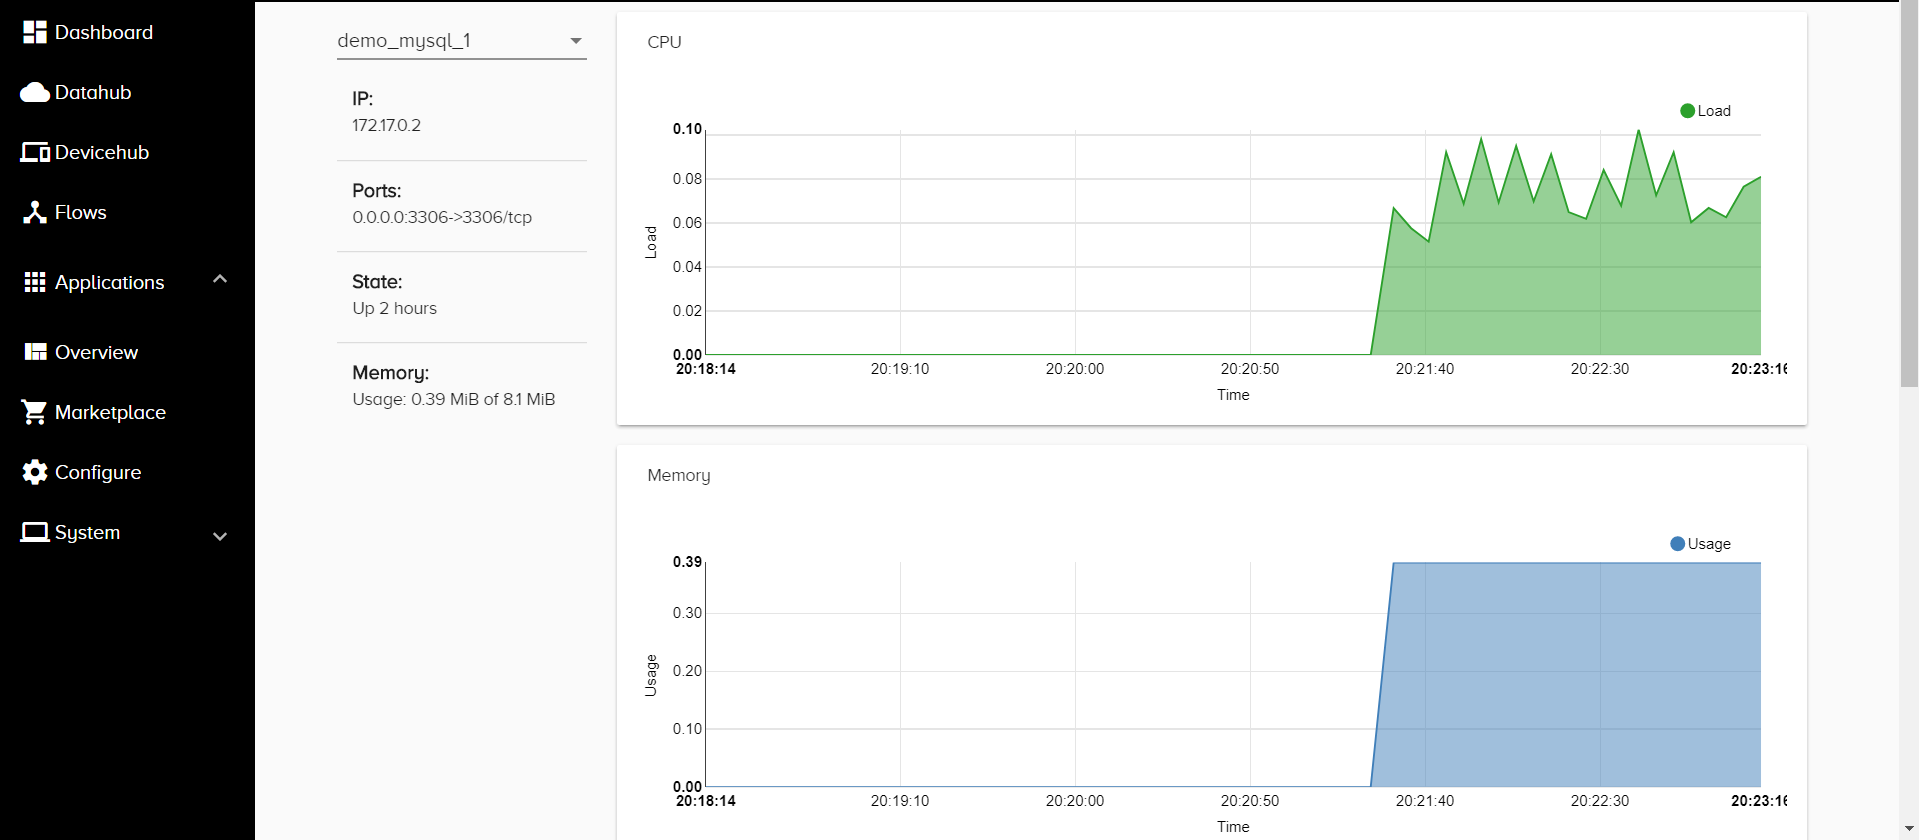
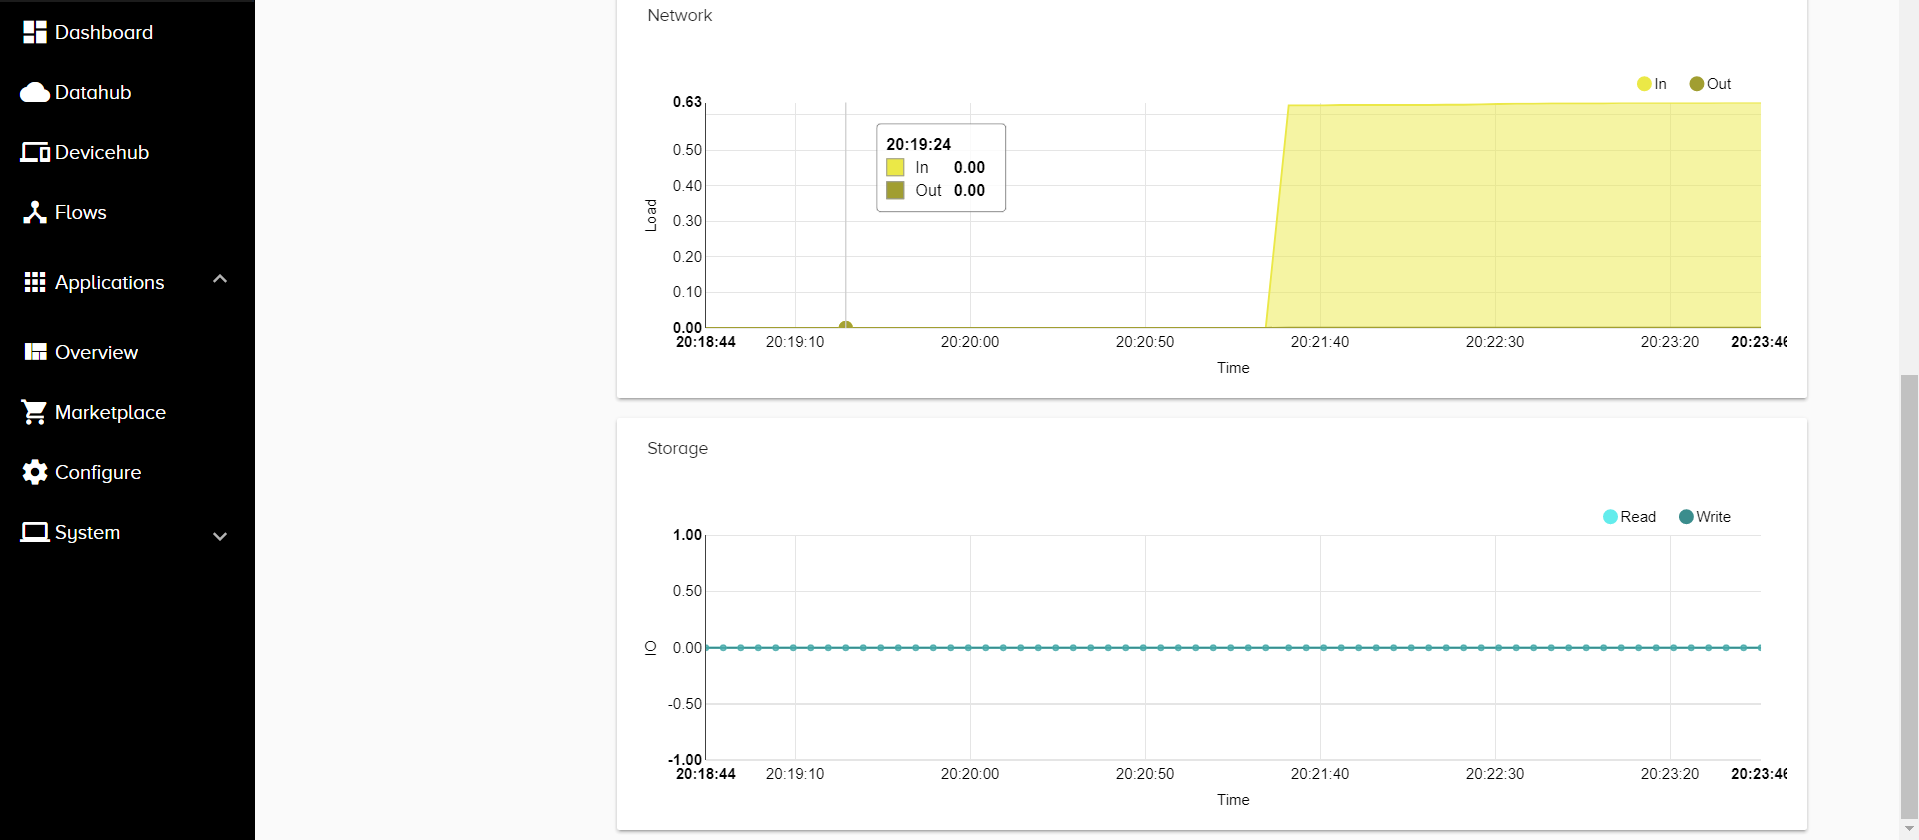
Clicking an application also provides graphs of the CPU, Memory, Network, and Storage usage by it. Mousing over the chart provides further details at a particular time point.
The X axis of the graph is the time. The following units represent the Y axis depending on the type of graph:
- CPU: A number ranging from 0 to 2.00. 0 means that there is no CPU backup, 1.00 means that the CPU is at full capacity, and 2.00 means that the CPU is currently backed up with too many processes.
- Memory: Megabytes
- Network: mbps (Megabits per Second)
- Storage: A number ranging from -1.00 to 1.00 representing the percentage of time waiting on disk IO speed.