Flows Charts
Estimated reading time: 3 minutes
This example shows how to create a chart in Flows.
Creating the Chart
To create a temperature chart in Flows:
-
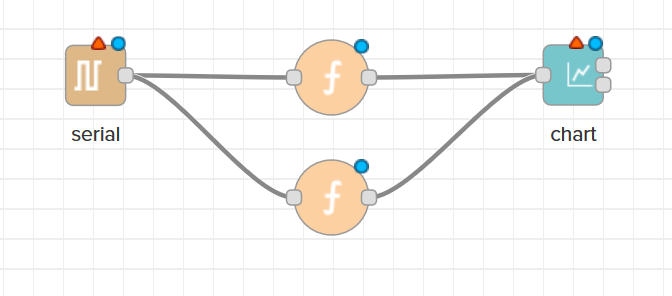
Use a Serial In node. Connect it to two Function nodes. Connect both Function nodes into a single Chart node. The flow should look like the picture below:
Make sure that there is a new dashboard tab and group for the chart node. For more information on this, take a look at Flows Dashboard Basics.
-
Double-click the Serial In node and select the port for your device. Click Done.
The device sends messages containing temperature data in this example.
-
Double-click one of the Function nodes and name it Fahrenheit. Enter the following lines of code to return the temperature in Fahrenheit:
msg.topic = 'Fahrenheit'; // Names the chart line "Fahrenheit". var f = msg.payload; // Stores the payload string in a new variable. msg.payload = parseFloat(f).toFixed(2); // Stores just the number from the string up to 2 decimal places. return msg; -
Click Done.Double-click the other Function node and name it Celsius. Enter the following lines of code to convert temperature in Fahrenheit to Celsius:
var faren = msg.payload; // Temperature from the device in Fahrenheit. var cel = parseFloat(5 / 9 * (parseInt(faren) - 32)).toFixed(2); // Converts Fahrenheit to Celsius up to two decimal places. msg.payload = cel; // Sets the display value on the chart to be our Celsius calculation. msg.topic = 'Celsius'; // Gives the name "Celsius" to the second line of the chart. return msg; -
Click Done.Double-click the Chart node. There are a number of options for the chart type, the labels, and the colors.
Feel free to experiment with colors for your lines. It will display the color in the upper left for the first line, the color in the middle of the top row for the second, and the color in the upper right for the third and so on.
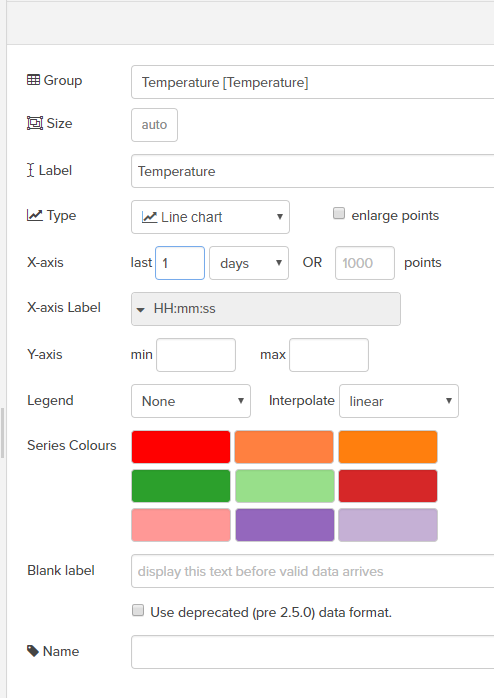
Flows charts supports up to 9 differently colored lines on the same chart.
-
Click Done. Add an Inject node, a Function node, and a Serial Out node connected to each other below your original set of nodes.

-
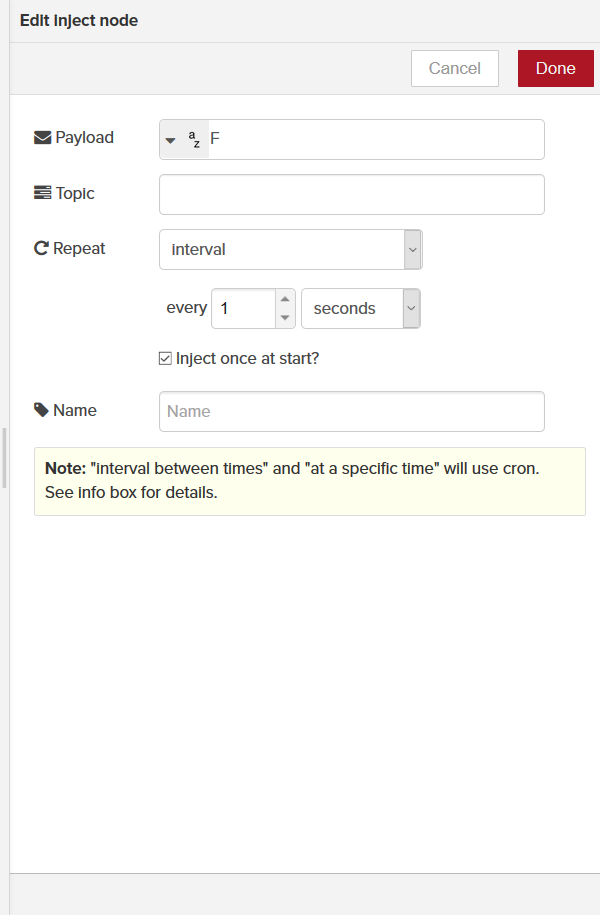
Double-click the Inject node to configure it. Enter a string for its payload (F for Fahrenheit temperature with this example device) and a time interval for sending the payload.
-
Click on the dashboard tab below. Click
 to view your chart in a new tab.

You may need to wait some time to collect enough data for a proper line chart.
JSON Nodes
Import the JSON below to create the flow as described in the steps above. See Export and Import Flows for more information on importing JSON into a flow.
[{"id":"cc6e24f5.679078","type":"function","z":"7a19697d.90f9f8","name":"Farenheit","func":"msg.topic = 'Farenheit'; // Defines the first line\nreturn msg;","outputs":"1","noerr":0,"x":345,"y":160,"wires":[["65c811fe.9c112"]]},{"id":"30261685.37c82a","type":"Datahub Subscribe","z":"7a19697d.90f9f8","name":"Temperature","natc":"4dc4ed0f.7956a4","topicname":"Farenheit","x":200,"y":160,"wires":[["cc6e24f5.679078","89f29cab.58e68"]]},{"id":"89f29cab.58e68","type":"function","z":"7a19697d.90f9f8","name":"Celsius","func":"var faren = msg.payload; // Temperature in faernheit\nvar cel = parseFloat(5 / 9 * (parseInt(faren) - 32)).toFixed(2); // Converts farenheit to celcius\nmsg.payload = cel;\nmsg.topic = 'Celcius'; // Defines the second line\nreturn msg;","outputs":1,"noerr":0,"x":345,"y":240,"wires":[["65c811fe.9c112"]]},{"id":"65c811fe.9c112","type":"ui_chart","z":"7a19697d.90f9f8","name":"","group":"7e97ab8d.5d84b4","order":0,"width":0,"height":0,"label":"Temperature","chartType":"line","legend":"false","xformat":"HH:mm:ss","interpolate":"linear","nodata":"","dot":false,"ymin":"","ymax":"","removeOlder":"1","removeOlderPoints":"","removeOlderUnit":"86400","cutout":0,"useOneColor":false,"colors":["#ff0000","#ff8040","#ff7f0e","#2ca02c","#98df8a","#d62728","#ff9896","#9467bd","#c5b0d5"],"useOldStyle":false,"x":480,"y":160,"wires":[[],[]]},{"id":"aeb91e0c.2db36","type":"inject","z":"7a19697d.90f9f8","name":"","topic":"","payload":"","payloadType":"date","repeat":"1","crontab":"","once":true,"x":240,"y":360,"wires":[["5ad046c8.608078"]]},{"id":"8d287104.b4cd6","type":"Datahub Publish","z":"7a19697d.90f9f8","name":"","natc":"4dc4ed0f.7956a4","topicname":"Farenheit","x":460,"y":360,"wires":[]},{"id":"5ad046c8.608078","type":"function","z":"7a19697d.90f9f8","name":"","func":"var run = (Math.random() * (86 - 80.75) + 80.75).toFixed(2);\nmsg.payload = run;\nreturn msg;","outputs":1,"noerr":0,"x":345,"y":360,"wires":[["8d287104.b4cd6"]]},{"id":"4dc4ed0f.7956a4","type":"Datahub Connect","z":"","ipadd":"127.0.0.1","port":"4222"},{"id":"7e97ab8d.5d84b4","type":"ui_group","z":"","name":"Temperature","tab":"325bd8cd.3b1cd8","disp":true,"width":"6","collapse":false},{"id":"325bd8cd.3b1cd8","type":"ui_tab","z":"","name":"Temperature","icon":"dashboard"}]